TORUS Maps history and roadmap

TORUS Maps — RoadMap
Primary TORUS Maps R&D future plans
Export & Import
- export data in vector formats;
- export data in raster formats, vector to raster conversion;
- export to support styles and colors for saved states of the map;
- import user’s data in various formats.
Improved GeoProcessor module
- coverage maps calculation (e.g., voice/data traffic, subscribers distribution and service coverage maps) in high-resolution;
- quick calculation of complex geometric objects based on data (e.g., service zones and trouble zones);
- advanced analytics for collections of similar data through time.
Clusters
- data aggregation over object sets defined by user;
- define object sets by topology or geo-filters, import sets from external systems;
- visualize aggregated data on map as a single element.
Improved UI
- new tools for data filtering;
- improved geocoding and search tools;
- new tools for styling thematic maps and heatmaps;
- better tools for integration and synchronization of coordinates, windows, settings, etc.
Smart Search
- integration with the new GISware Intregro product – SmartSearch – which improves search for information stored in various systems.
Population
- population data import, aggregation and analysis;
- calculation of high-resolution population density maps (accuracy up to 50m).
New Geo Tools
- new tools for data query: geo-objects cross-intersection, objects under object, buffer zone around the object;
- tools for area and azimuth calculation;
- control after the servicemen crews (or deliverymen) on the route;
- integration of elevation maps.
Smart Automatic Analyzer
- analysis in arbitrary zones selected by users;
- use vector buildings map in analysis;
- random events correlation (correlation of data of different types).
AI
- get use of machine-learning algorithms to improve analysis results;
- automated detection for inter-data correlations;
- voice input, chatbots.
TORUS Maps History

TORUS Maps — History
2015 – the prototype of TORUS Maps platform was introduced, which included:
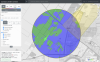
- Web-app Core – web application that renders various object layouts, interactive objects, a ruler, time axis and search toolbox on top of the background tile-maps taken from different providers;
- Geometry Calculator – calculates objects’ geometry based on data: aimed sectors (pies), simplified coverage maps. Objects are sized and styled dynamically;
- Reverse Geocoding – converts point coordinates into postal address by request into geocoding provider service;
- Neighbors – tools to visualize and explore neighbor cells, their interdependencies, visualize indicator values for the pair of neighbor cells (e.g. handovers), support for different types of neighborhood bonds (planned, configured, etc.);
- Interactive Tutorial – help system interface provides interactive tutorial as part of the basic application’s UI.
2016 – new features and applications extended TORUS Maps platform prototype:
- Operator’s Map – a separate web-application for the first-tire Customer Support Services operators. Provides a simplified interface for the actual network state monitoring;
- Own OSM Server – OpenStreetMap server adds support for background tiled maps generation and exposes some searching tools with autofill feature. Synchronized to osm.org daily;
- Improved Geocoding – adds support for various external geocoding providers, including Yandex, OSM, Google;
- Layers Control, Filtration, Charts – manipulation of extended layers and group of layers, including filtering, transparency adjustment, captions and other attributes management. Micro-charts displaying data on the map were added;
- States and URLs – saves and restores user’s personal UI layout and map configuration, allows to manage the map through URL parameters for third-party systems integrations.
2017 – TORUS Maps β-version:
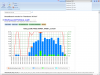
- Timing Advance, Propagation Delay – visual analysis for RAN statistics including cell serving range distribution analysis;
- Bookmarks Export & Import – selected objects can be added into bookmarks, which could be exported and imported in various formats (geojson, kml, csv);
- Multilanguage – internationalization for UI (RU and EN localization are available);
- Tables – visualize data on a variety of objects in tabular form which also can be exported.
2018 – TORUS Maps 1.0 release. New features and new applications tailored for certain departments:
- Template Analyzer & Operator Mode – after in situ situation analysis system automatically generates suggestions to the 1st-tire support operator on what to say to the customer about network problem and terms when it will be fixed;
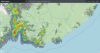
- Coverage Calculator – calculated maps of actual and planned service coverage, considering network statuses and conditions;
- Mass Geocoding – geocoding in bulk batches;
- Forced Security – more security checks, limit access to application according to flexible roles and privileges model, extended logging of user activity;
- Shared States – publish and share personal application states (customized UI layout and maps configurations) among users;
- Operator’s Coverage Comparison – visually compare service coverage maps of competitor Telecom operators.
2019 – TORUS Maps 1.2 release. New data types processing:
- LBS – locate subscriber by its phone number, track the history of its movements;
- POI – visualization of updatable points layer. Useful for adding sales offices, registered requests locations, georeferenced notes onto the map;
- Problem Areas – automatic registration of mass problems zones according to custom aggregation criteria, manual registration by placing arbitrary polygons and combining several zones into one;
- S2 Aggregation – S2 geometry grid for automatic aggregation of georeferenced requests and notes on the map.
2020 – TORUS Maps 1.3 release. New objects types calculation and visualization:
- Trouble Zones (Degradation areas) – calculates and visualizes the service coverage maps considering quality degradation areas due to various accidents almost in real-time, estimates amount and structure of subscribers affected by the accident;
- Traffic maps – calculates the voice/data traffic and subscribers distribution maps;
- Heatmaps – visual analysis for the clusters of points of various distribution nature.
News
13 September, 2022
New version of OSS TORUS supports alternative and opensource RDBMS - PostgreSQL. This now allows to optimize costs for... more
01 November, 2021
November 1st, 2021, GISware Integro releases OSS TORUS system — the fourth generation of software for networks... more
23 July, 2021
GISware Integro company proudly presents TORUS Maps – a new web-based GIS platform for visual analysis and interactive... more
01 February, 2021
A prototype of new Smart Search system was rolled out by GISware Integro company in Tele2 Russia, — being an innovative... more
25 December, 2020
SmartGIS system built on top of our TORUS Maps software platform was successfully integrated by GISware Integro company... more